Probabilistic Thinking

Last week, I finished Nate Silver’s book The Signal and the Noise. In the final chapter, he used research and anecdotes about the US counter-terrorism field to address the point that when forecasting future events, we have to be mindful of the “unknown unknowns”. The signals missed or not assigned enough importance in historical attacks like WWII’s Pearl Harbor and 9/11 are unknown unknowns because they were beyond the scope of imagination, and therefore no probability was even assigned to them. If the national security intelligence had considered the probability of these events, then lots of useful signals wouldn’t have passed by unattended, but instead would have been used to adjust the probability of these events, therefore leading to different outcomes.  Adopting probabilistic thinking and realizing there are unknown unknowns will be helpful in all fields of forecasting.

Homeland Memes

Silver’s take also reminds me of the portrayal of counter-terrorism in the hit drama Homeland (spoilers ahead). The show’s protagonist, CIA analyst Carrie Matheson, is often portrayed as a loose cannon who pursues leads that counter the conventional wisdom or are regarded as impossible by her peers. For example, she is the only person in the agency who even suspects that returning war hero Sgt. Brody could be turned by terrorists, based simply from a piece of intel she gathered from the field. Carrie refuses to discard her far-fetched theory and eventually builds enough evidence to demonstrate a realistic probability Brody really has been turned. For drama’s sake, Homeland often shows Carrie as overly emotional due to her bipolar personality, and characterizes her findings as “gut feelings” by quickly panning over the huge amount of data she has collected and the maps on her wall linking together random events. As an experienced 14-year analyst with rich field experience and so much data in her hand, her knowledge about the subject exceeds that of her peers, which allows her to reduce the unknown unknowns in her knowledge scope, and helps her perceive unlikely events as possible.

In statistics, there are measurements of central tendency, but what are also important are the variance in each data set, the outliers, the whales, which shouldn’t be ignored. Instead these factors should be properly considered and weighed in their context, and help reduce the number of unknown unknowns for us.

 

Before We Speak with Data

Last week, I began an online statistics class at the awesome online education site https://www.coursera.org/, which offers free classes from institutions around the globe. I highly recommend this site to anyone who is interested in learning things on their own. Coursera’s courses range from statistics to science to literature. The class I’m taking is taught by Professor Andrew Conway from Princeton University. It has helped me refresh my memory on statistics knowledge I learned way back in my undergraduate school, and it has also let me pick up new skills on using some data analysis tools like R.

At my work, I often need to look at data charts, build reliable business models, and glean consumer insights from the fluctuations in data trends. This course, like Nate Silver’s book, keeps me grounded on tried and true statistics fundamentals, and gives me a good framework when looking at the causal results from our own experimental research and product AB tests.

One of the biggest takeaways so far is to avoid biases when looking at data. Before we jump to a conclusion in any data analysis, we need to check the source of the data sample, distinguish between independent variable and dependent variable, confirm that test shards are truly randomized, and examine other confounds that could potentially skew the results. Also, we have to keep in mind that experimental research usually yields a stronger causal relationship than correlational research. In the business world, we often tend to identify correlation between signals, but they don’t necessarily guarantee a causal relationship between two measurements.

Okay, that’s a wrap on my data learning for this week! It’s getting hard to write anymore with a marathon of my favorite show, “Homeland”, playing in the background. Season 3 premieres tonight, and I can’t wait for the crazy-intense drama to unfold!

Navigating through The Signal and The Noise

In my digital media graduate program at USC, I took courses in online research and participated in a couple of doctorate-level online research projects. The knowledge I gained about statistics, online research tools, network theory and other very fundamental yet practical data analysis skills have been extremely helpful in directing the decision-making process and driving the success of product development and media campaigns at my work. I have recently started reading the statistician Nate Silver’s book The Signal and the Noise, and have tried to deepen my understanding of business forecasting through his take on using statistics-based forecasting of real world events.

In The Signal and the Noise, Silver dives deep into how data is used to forecast in multiple arenas like finance, politics, baseball, weather, earthquakes, computer-automated chess programs, and poker. Some insights in the book are from his own experience: besides his more “normal” job working for a Big Four accounting firm, he developed a professional baseball forecast system, PECOTA, tried to make a living by applying his probability skills at online poker, and founded the famed New York Times-hosted politics and stats blog, FiveThirtyEight.com. Some of the stories in his book are from his in-depth research of other industries that rely heavily on forecasting systems, like the weather forecasting industry. By scrutinizing the process and biases in these forecasting industries, he pointed out the noise and biases mixed in the data forecasting models,and gradually establishes more reliable processes to his readers.

This book is very dense, and definitely not as fast a read as most of my light-hearted summer readings are. Statistics can sometimes be dry, but the way Silver weaves storytelling into his statistical insights made the book a pleasant page-turner for me.

The two chapters I finished this week were about chess battles between the world’s best chess player and IBM’s Deep Blue computer, and the online poker bubble.

In the first story, the author tries to convey the fortes and weaknesses of a computer-forecasting system, and likewise with human forecasting abilities. Silver came to the conclusion that technology and computers are best at logical and tactical calculations involving immense calculation power, but they are only as good as the data logic and inputs directing them. On the other hand, human brains, with our imaginative thinking capabilities, are stronger at establishing a holistic picture and making strategic moves, though we can also fall prey to our biases and emotions. Humans should harness computers and technology when possible, but we also need to avoid blindly worshiping technology and the data it outputs.

In the poker bubble story, Silver relates to his personal experience in the pro online poker world. He revisits the ups and downs of the online poker industry, and reveals his skills on how to make probabilistic judgement on cards, on opponents’ hands, and interestingly, he shows how poker is a field where luck plays almost as a large role as skills. Poker is a world where the signal and the noise are inevitably mixed, just like in many fields of our own lives. It is hard to look at a result in the short term and identify whether it is signal or noise. We need to stay cautious in a very results-driven environment, and a wise forecaster should always examine the process to test its reliability, rather than solely relying on volatile results.

I’ve picked up on some great insights so far, and I look forward to the rest of the book.

A New Hope

I am restarting my blog after a hiatus of three years. In the past three years, I finished my USC graduate school program in digital media; did a fantastic internship with Paramount Pictures marketing movies online and campaigning for Academy Awards; met so many amazing people cross different walks of life; and landed my dream job with Disney, where I currently work on entertainment digital product design and management. I’ve been busy!

It has been a demanding and also rewarding journey. But most important of all, I’ve missed writing. I miss the times I spent with myself, reflecting on observations of my daily life, and the exciting shifts in the digital media landscape.

With this brand new start, I will continue to share my thoughts, readings, and work experience related to digital entertainment product development, and how to use data to decipher the intertwined worlds of human connections, business intelligence and digital engagement.

I am learning through practicing, and I feel very fortunate to be able to work on things I love, and with a group people that inspire me. I once read a saying somewhere that I want to use as my career motto:

“Don’t just get things done, make things happen.”

Though I am sometimes bogged down by my busy schedule, I should not forget this motto, and re-booting this blog is a great way for me to make things happen again instead of just getting things done in my life.

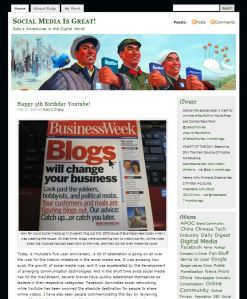
With that being said, in light of my new experiences over the past three years, as well as my transition from an aspiring digital media student to a digital industry professional, I think it’s time for my blog to reflect my new interests in data-driven media and product development insights. So, bye bye to my previous blog theme, “Social Media is Great!” And hello to my brand new “Data and Lore” blog. I have added a screenshot of my former blog theme to commemorate it.

Hey, world! I’m back!

rubysblog